Air-sea flux is an important parameter for large-scale atmospheric dynamics, such as air-sea interaction, global climate change, ocean circulation, hurricane development, generation of ocean waves, mixing layers, and the seasonal thermocline. In recent years, because of further research on the ocean surface and lower-atmosphere biogeochemistry coupled with physical processes, air-sea flux has become important also for marine biologists, water chemists, and physical oceanographers[1]. During the process of air-sea exchange, bubble plumes entrained by the breaking waves play vital roles in generating sea-salt aerosol and wave acoustics and in forming particulate matter and seston[2]. Therefore, there is much interest in the mechanism whereby bubble plumes are entrained by breaking waves. Projects such as International Global Atmospheric Chemistry, the Joint Global Ocean Flux Study, and the Surface Ocean and Lower Atmosphere Study are interested specifically in air-sea interaction, making it a major part of their research.
Currently, the main ways to observe bubble plumes involve imaging, acoustics, and probes[3]. Imaging is the most intuitive method, but it becomes prohibitively expensive when attempting to capture plumes processes that require millisecond time resolution or that are widely distributed[4]. Acoustic methods are better in the latter case but do not have sufficient spatial resolution to capture any micron-sized features in bubble plumes[5-6]. In recent years, optical-fiber probe (OFP) technology has come into widespread use. It is the best way to observe bubble-plume entrainment by breaking waves precisely on millisecond time scales and micron length scales. Serdula, et al[7] and Rojas, et al[8] pioneered the use of single-tip OFPs to observe large-diameter bubbles generated in a wave tank. Blenkinsopp and Chaplin[9-10] then used an improved dual-tip OFP (DT-OFP) to observe large bubble plumes in a wave tank. However, there is much scope for improving current OFP technology in relation to its performance and structure. In particular, because of its superior optical, mechanical, and chemical properties, sapphire optical fiber is coming into use for measuring two-phase flows[11]. Hence, we propose herein a sapphire-based DT-OFP, focusing mainly on its two probe tips (PTs) and how to match them in a single probe. We use the Zemax optical design software to optimize the design with respect to the working performance of the DT-OFP.
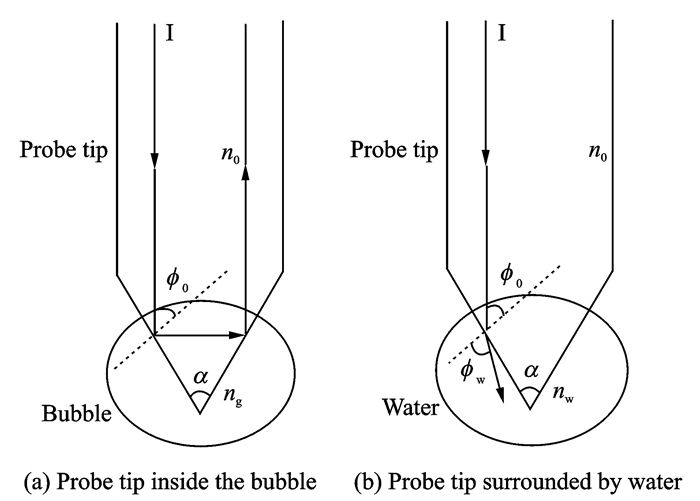
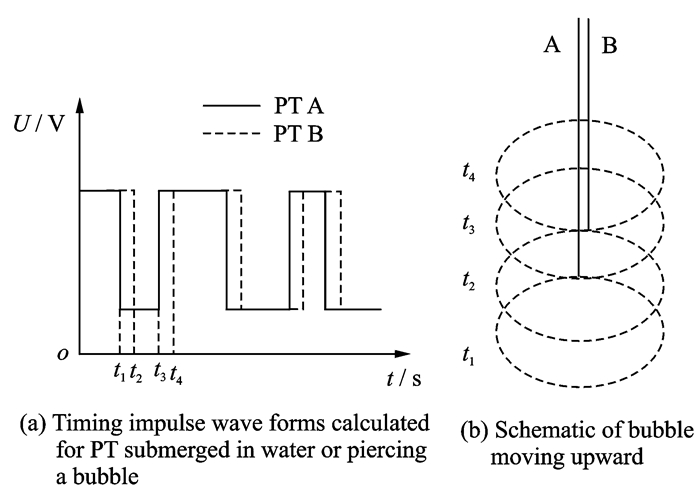
1 Theory for Measuring Bubble Parameters with Optical-Fiber ProbeBased on total internal reflection and light refraction, OFP technology can be used to measure bubble parameters as shown schematically in Fig. 1. This involves an incident ray Ⅰ (of ray intensity P), a PT cone angle α, and the refractive indices of the probe, bubble, and water (n0, ng, and nw, respectively). The intensity of the ray reflected from the PT differs according to whether the PT is submerged in water or has pierced a bubble. When the PT pierces a bubble, total internal reflection arises when the incident ray arrives at the probe/air interface. By contrast, when the PT is submerged in water, refraction takes place because the refractive index of water exceeds that of the PT. With regard to detecting bubbles in two-phase flows, the higher-intensity ray reflected from the PT when it pierces a bubble causes a higher signal level in the sensor. By contrast, the lower-intensity ray reflected from the PT when it is submerged in water causes a lower signal level in the sensor[12]. The different signals generated by the sensor are shown in Fig. 2(a). In Fig. 2(a), t1—t4 are the time when the probe tip (PT) touches the bubble surface and U is the output voltage of optical-electrical converter versus time t.
|
Fig. 1 Theory of bubble recognition through OFP technology |
|
Fig. 2 Theoretical basis for DT-OFP |
The theoretical basis for using a DT-OFP to measure bubbles entrained by a breaking wave is shown schematically in Fig. 2(b). Assuming that the bubbles move at a constant speed (regardless of any bubble deformation or sideways movement), the bubble velocity can be calculated as follows[13]
| $ v = \frac{{{v_a} + {v_b}}}{2} = \frac{1}{2}\left( {\frac{L}{{{t_2} - {t_1}}} + \frac{L}{{{t_4} - {t_3}}}} \right) $ | (1) |
where va and vb are the bubble velocities when the PT penetrates the upper and lower surfaces, respectively, and L is the difference in vertical position between the two PTs.
The chord length la of the bubble can be calculated from the bubble velocity v as follows
| $ {l_a} = v \cdot \left( {{t_3} - {t_1}} \right) $ | (2) |
It is necessary to apply a statistical correction to calculate the equivalent bubble size distribution[9], from which the probability density function of bubble diameter can be analyzed.
To estimate the void fraction β in a two-phase flow, we use Eq.(3)
| $ {\beta _g} = \frac{1}{T}\sum\limits_{i = 1}^{{N_g}} {{{\left( {{T_g}} \right)}_i}} $ | (3) |
where Tg is the bubble residence time at the PT, T the total sampling duration, and Ng the number of bubbles recorded in time T.
2 Simulation Model of Probe TipAn OFP sensor consists of two main parts, namely the PT and the photoelectric conversion module. However, the sensor performance is affected most by the PT. Therefore, to optimize the design in relation to material, shape, and PT cone angle, we use the Zemax optical design software to simulate the PT. The PT optimization is aimed at rising the intensity of the ray reflected from the PT and reducing the coupling loss during optical transmission. There are several optimization procedures including establishing models, optimizing light path and structure parameters.
Depending on the non-sequential pattern in Zemax[14], we perform ray-tracing simulations of the light transmission inside the PT. We begin by defining the components of the system as a radial source, a detector, an optical fiber, a PT, a bubble (spherical in this case) and a water tank. Then, based on practical application, we set the radial-source output efficiency to 3.75 mW and the OFP outer-layer and inner-transmission materials to LZ_NEWGLASS and SILICA(Zemax settings), respectively. We set the PT material as Al2O3 initially and its shape as conical (Further optimization of the PT would be discussed later). The PT ray-tracing simulation model is shown in Fig. 3, in which the slender rectangle with a conical head represents the OFP, the circle represents a bubble, the bigger rectangle on the right of the model represents the water tank, and the blue solid lines are the rays traced by the software.

|
Fig. 3 Front view of PT ray-tracing simulation model |
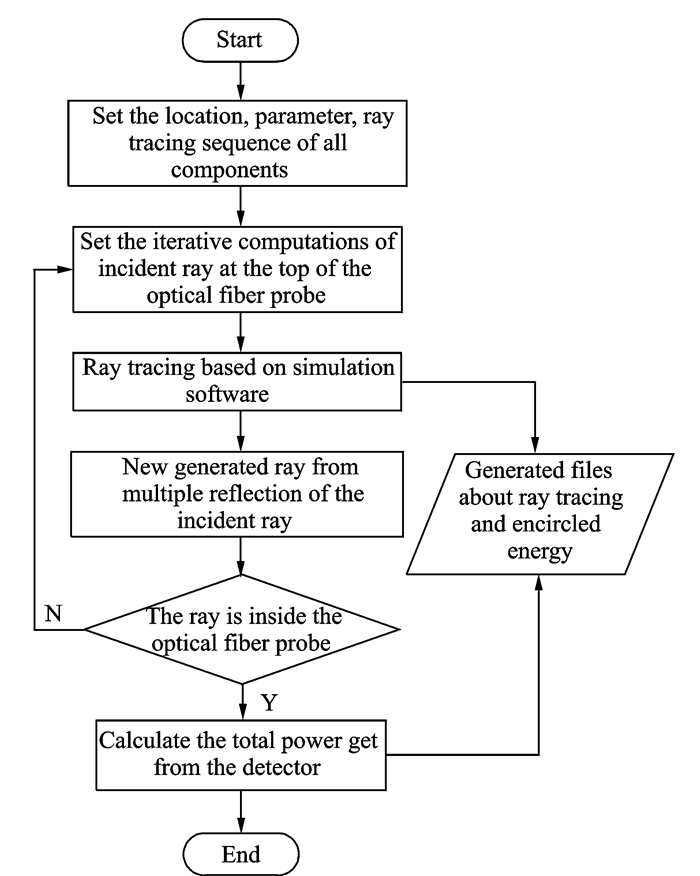
Finally, we use this model to analyze the intensity of the PT-reflected ray under different system conditions. A flowchart of the ray-tracing method is shown in Fig. 4.
|
Fig. 4 Flowchart for ray-tracing simulation of light transmission inside PT |
First, it is necessary to determine whether the PT can distinguish between bubbles and water in a two-phase flow, namely whether the corresponding difference in reflected ray intensity is sufficiently large. To assess this, we use the parameters of total power and peak irradiance (The peak irradiance is the maximum illuminance intensity per unit area projected in a specific direction). With the PT submerged in water, we obtain 8.335×10⁻⁵ W for the reflected ray intensity and 1.1 W/cm2 for the peak irradiance. By contrast, we obtain 2.149×10⁻⁴ W and 1.6 W/cm2, seperately, with the PT inside the bubble. Accordingly, the reflected ray intensity is higher by one order of magnitude when the PT pierces the bubble. Therefore, the PT is indeed capable of detecting bubbles.
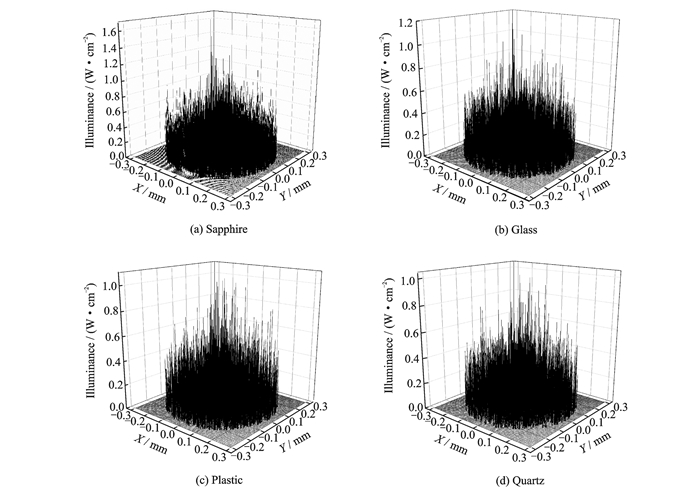
3 Optimum Design of Probe Tip 3.1 Optimum choice of materialWe use sapphire as the PT material, while other common PT materials are quartz, glass, and plastic. Holding all other parameters fixed, we set the PT material as AL2O3, BK7, PMMA, and SILICA. We run the simulation in each case and plot the peak irradiance in Fig. 5 using the Origin data-analysis software. In Fig. 5, X-Y plane represents area of ray detector in simulation model, Z-coordinate represents illuminance intensity, three-dimensional graphics represent the illuminance intensity of each point on the ray detector, and the peak irradiance is the highest for the sapphire PT.
|
Fig. 5 Illuminance for different PT materials |
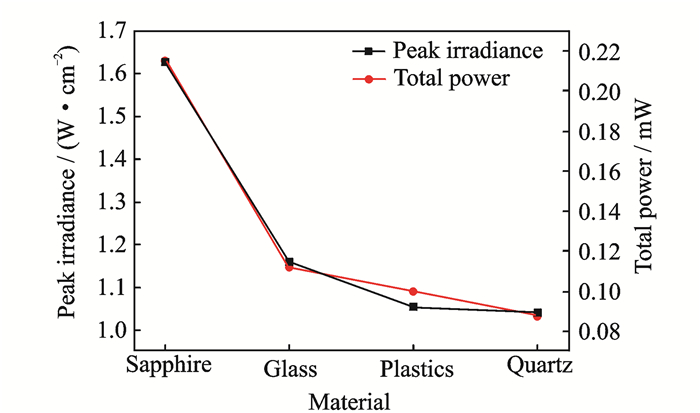
The calculated values of peak irradiance and intensity are listed in Table 1 and plotted in Fig. 6. The sapphire PT clearly performs best. From the illuminance data, we see that the irradiance is the highest in the center of the detector for each PT material and decreases toward the edge. In principle, each type of PT is capable of detecting bubbles. However, glass, plastic, and quartz PTs have certain inherent limitations. We list their advantages and disadvantages in Table 2.
| Table 1 Peak irradiance and intensity for different probe-tip materials |
|
Fig. 6 Peak irradiance and intensity for different PT materials |
| Table 2 Advantages and disadvantages of glass, plastic, and quartz probe tips |
Compared with the other three types of PT, the sapphire PT has better optical characteristics, good chemical stability and thermal tolerance. It is resistant to acidic and caustic corrosion, and is free from environmental impact. Considering the simulation results and the practical working environment, we deem the sapphire PT to have the best performance. Consequently, we choose sapphire as the PT material for marine applications.
3.2 Optimum shape of probe tipAfter chosing sapphire as the PT material, we must optimize the PT shape to improve the working performance further. Considering that a PT in actual use affects the surrounding flow, we are guided by the literature to analyze the following PT shapes: Conical, spherical, spherical conical, parabolic, and ellipsoidal.
We use the standard-lens method to set up ray-tracing simulation models for the PTs of various shapes. In Zemax, the standard-lens coordinate formula is expressed as
| $ z = \frac{{c{x^2}}}{{1 + \sqrt {1 - \left( {1 + k} \right)} {c^2}{r^2}}} $ | (4) |
where c is the curvature, x the abscissa value, and k the conic coefficient. For k = 0, the PT shape is either spherical or conical. For k=-1, the PT shape is a paraboloid, and for k < -1 the PT shape is a hyperboloid. For -1 < k < 0, the PT shape is ellipsoidal.
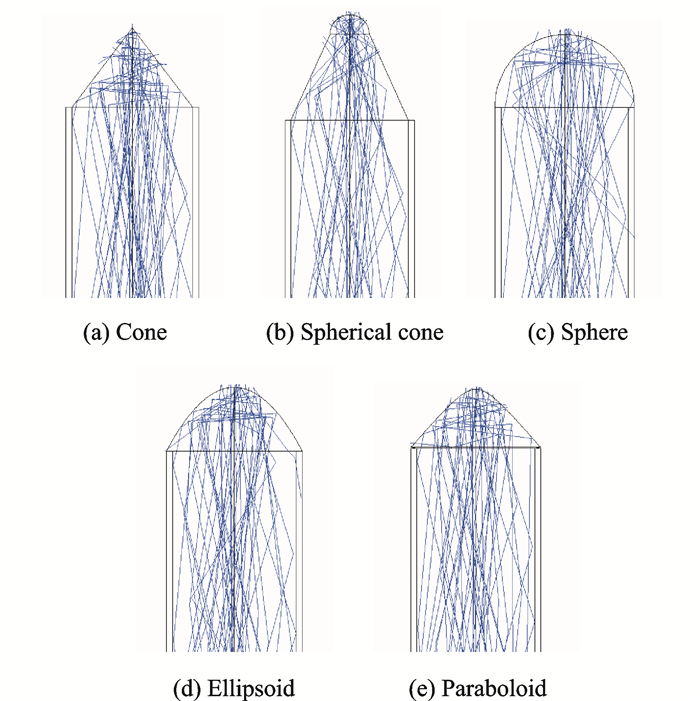
In the simulation models, we adjust the standard-lens parameters of thickness, radius, and conic coefficient to get the various aforementioned PT shapes. We then run 106 ray-tracing simulations for each shape, the results of which are shown in Fig. 7, where the blue lines represent the rays traced by the software.
|
Fig. 7 Side views of ray-tracing simulations for the PTs of various shapes |
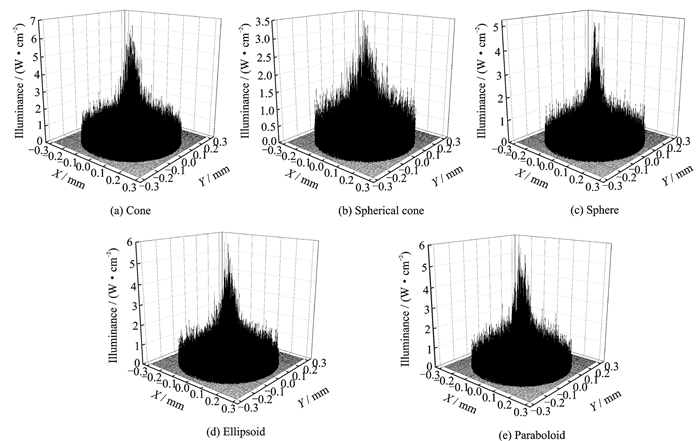
The various distributions of illuminance are shown in Fig. 8, plotted by Origin after receiving the detector data.
|
Fig. 8 Illuminance for the PTs of various shapes |
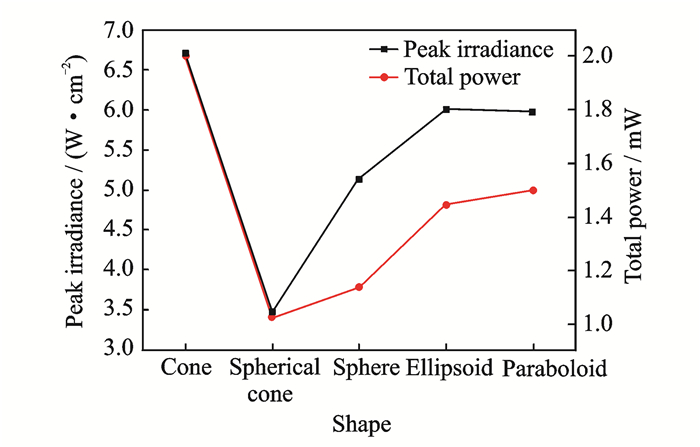
Fig. 9 shows the intensity and peak irradiance for each PT shape, in which the conical PT clearly gives the best performance and the spherical-cone PT gives the worst.
|
Fig. 9 Peak irradiance and intensity for the differently shaped PTs |
Analyzing the illuminance for the differently shaped PTs shows that the irradiance is the highest at the center of the detector in each case and decreases to almost zero at the edge. Furthermore, the illuminance distributions for the various PT shapes are similar. As shown in Fig. 8, higher illuminance is recorded for the conical and ellipsoid PTs compared to the other shapes. However, for the conical PT, the illuminance is most obviously concentrated at the center of the detector and the peak irradiance is the highest. By contrast, the peak irradiance is the lowest for the spherical-cone PT. Equivalently, the intensity is the highest for the conical PT and the lowest for the spherical-cone PT. Consequently, we decided a cone to be the best PT shape for marine applications.
3.3 Optimum design of probe-tip cone angleBased on the theory in Section 2 for recognizing bubbles using OFP technology, the incident ray is influenced by the cone angle, thus affecting the intensity and illuminance distribution received by the detector. Hence, to improve the PT detection sensitivity, we should determine the optimum cone angle. We do so in this section, using Zemax again to further optimize the PT.
In Section 2, we set the OFP radius to 0.3 mm in the simulation model. So, we only need to adjust the PT length for controlling the cone angle and hence to ascertain the optimum value (or range of values) of the cone angle according to the simulation results. Considering the OFP fabrication process, we investigate the cone-angle range of 30°—90°. The PT lengths corresponding to various cone angles (in 5° intervals) in this range are calculated geometrically and listed in Table 3.
| Table 3 Relationship between probe-tip length and cone angle |
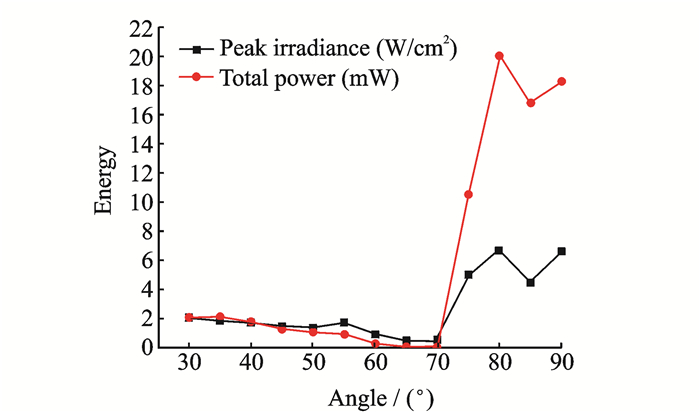
We need to adjust only the PT length while keeping the other parameters unchanged, similar to optimizing the PT shape. For the conical PT, the peak irradiance and intensity received by the detector are shown in Fig. 10 for the different cone angles.
From Fig. 10, the intensity slowly decreases initially with cone angle, reaching a minimum around 65°. It then begins to rise rapidly at roughly 70°, reaching a maximum around 80°. If we consider the simulation results only, the best performance should be achieved with a PT cone angle of 80°. However, given the practical working environment, the bubbles in the plumes entrained by the breaking waves could be any shape or size. The smaller the PT angle is, the more easily the PT pierces the bubbles, thus improving the sensitivity and accuracy of the PT and making it easier to detect smaller bubbles. Given that Fig. 10 shows a relatively high intensity for a cone angle of 35°, we choose this value for our conical PT.
|
Fig. 10 Peak irradiance and intensity for conical PT with different cone angles |
From the simulation results, the intensity of the reflected ray received by the detector is of the order of 10 μW. Hence, we choose the OPT101 optical-electrical converter for the OFP sensor because it is a monolithic photodiode with an on-chip transimpedance amplifier. The OPT101 output voltage Vout is calculated as
| $ {V_{{\rm{out}}}} = {I_D}{R_F} + {V_B} $ | (5) |
where ID is the photodiode current, RF an internal feedback resistance of 1 MΩ, and VB a pedestal voltage of approximately 7.5 mV. Using this resistance, the photodiode responsivity is approximately 0.5 A/W at a wavelength of 940 nm. Hence, we calculate a theoretical output voltage of approximately 3.6 V based on the simulation results.
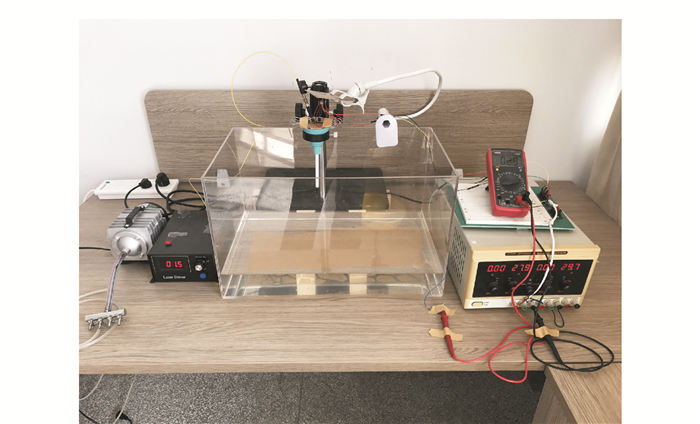
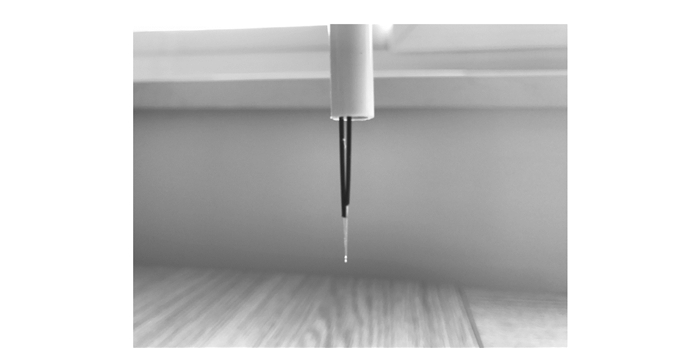
We then establish the OFP sensor using OPT101 and the optimally designed OFP tip with a conical sapphire tip of cone angle 35°. The detection system of the OFP sensor is shown in Fig. 11 and a picture of the sapphire OFP is shown in Fig. 12. The OPT101 is powered by a regulated power supply, and the output voltage as measured by a multimeter is 3.2—4.5 V. The test results are subject to two major uncertainties: The output power of the infrared laser fluctuates around the set value, and the OPT101 is sensitive to the ambient lighting. When the output power of the infrared laser is lower (higher) than the set value and the ambient lighting is weak (strong), the minimum (maximum) OPT101 output voltage is 3.2 V (4.5 V), and the theoretical value lies in this range of output voltage. Note that we obtained the peak irradiance and intensity of the optimized OFP by simulation to choose an appropriate optical-electrical converter. As long as the experimental and theoretical values are of the same order of magnitude, the experimental output value can be used to process signal as input signal of microcontroller. Therefore, the test results are reasonable considering the influence of the external environment and the measurement error of the experimental apparatus.
|
Fig. 11 Detection system of the OFP sensor Left: Air pump and infrared laser. Center: Water tank, sapphire OFP, and OPT101. Right: Multimeter and regulated power supply |
|
Fig. 12 Sapphire OFP |
4 Conclusions
In this paper, after analyzing the limitations of the existing OFPs regarding their optical and mechanical properties, we demonstrated that the optimum OFP design is the conical sapphire tip with a cone angle of 35°. According to Zemax, an OFP of this design could be used to observe bubble plumes entrained by breaking waves. We then tested a bespoke OFP sensor and obtained results that were consistent with those predicted theoretically.
However, several shortcomings must be considered. For example, we optimized the structure of only one PT of a DT-OFP without considering the overall operating efficiency of the two PTs. When using a DT-OFP to detect bubble plumes, the simulation results obtained herein would be applied as if the probe had a single PT. In addition, the spatial distribution of the two PTs of the DT-OFP requires further simulation and testing. Hence, future work should concentrate on optimizing the integrated design of the DT-OFP. Furthermore, the present simulation results could be considered to apply to a multiple-tip OFP as well.
| [1] |
ZHANG Shuwen. Air bubble entrainment by breaking waves and estimation of the related statistical quantities[J]. Acta Physica Sinica, 2008, 57(5): 3287-3292. |
| [2] |
LI Xinming. The air bubbles in the sea and their significance in physical oceanography[J]. Transactions of Oceanology and Limnology, 1984(3): 987-991. |
| [3] |
FERREIRA L F, ANTUNES P, DOMINGUES F, et al. Monitoring of sea bed level changes in nearshore regions using fiber optic sensors[J]. Measurement, 2012, 45(6): 1527-1533. DOI:10.1016/j.measurement.2012.02.026 |
| [4] |
CAO Ruixue. Measurement and analysis of bubbles in ocean surface layer and sub-surface layer[D]. Beijing: Institute of Oceanography, Chinese Academy of Sciences, 2006.
|
| [5] |
TERRILL E J, MELVILLE W K. A broadband acoustic technique for measuring bubble size distributions:laboratory and shallow water measurements[J]. Journal of Atmospheric & Oceanic Technology, 2000, 17(2): 220. |
| [6] |
WU X J, CHAHINE G L. Development of an acoustic instrument for bubble size distribution measurement[C]//Proceedings of the 9th International Conference on Hydrodynamics. Shanghai, China: China Ocean Press, 2010: 330-336.
|
| [7] |
SERDULA C D, LOEWEN M R. Experiments investigating the use of fiber-optic probes for measuring bubble-size distributions[J]. IEEE Journal of Oceanic Engineering, 1998, 23(4): 385-399. DOI:10.1109/48.725233 |
| [8] |
ROJAS G, LOEWEN M R. Fiber-optic probe measurements of void fraction and bubble size distributions beneath breaking waves[J]. Experiments in Fluids, 2007, 43(6): 895-906. DOI:10.1007/s00348-007-0356-5 |
| [9] |
BLENKINSOPP C E, CHAPLIN J R. Bubble size measurements in breaking waves using optical fiber phase detection probes[J]. IEEE Journal of Oceanic Engineering, 2010, 35(2): 388-401. DOI:10.1109/JOE.2010.2044940 |
| [10] |
BLENKINSOPP C E, CHAPLIN J R. Void fraction measurements and scale effects in breaking waves in freshwater and seawater[J]. Coastal Engineering, 2011, 58(5): 417-428. DOI:10.1016/j.coastaleng.2010.12.006 |
| [11] |
RAHMAN M A, HEIDRICK T, FLECK B A. A critical review of advanced experimental techniques to measure two-phase gas/liquid flow[J]. Open Fuels & Energy Science Journal, 2009, 2(1): 54-70. |
| [12] |
YU Lina, DU Shengxue, LI Yingwei. Study on measurement method of gas holdup of oil-gas-water three phase flow based on sapphire optical fiber probe[J]. Well Logging Technology, 2014, 38(2): 139-143. |
| [13] |
LIU Feng, LIU ZHihua, ZHENG Junjie. Methodology of an improved technique for the bubble size measure in breaking waves using dual-tip optical fiber probe[J]. Chinese Journal of Hydrodynamics, 2013, 28(3): 283-290. |
| [14] |
KANG Jing. Research on structure optimization of array optical fiber probe sensor in oil well[D]. Qinhuangdao: Yanshan University, 2014.
|
 2018, Vol. 35


