2. School of Computer Science and Technology, Xidian University, Xi'an, Shaanxi 710071, P. R. China
Wired local area networks (LANs) can achieve the information transmission functions among the computers connected by the physical lines in reachable range.Wired LANs have many advantages in transmission rate, reliability and security over wireless LANs (WLANs)[1], which make it have wide application prospect in the future.Wired LANs can be applied in many fields, such as bank, military and company.How to effectively and reasonably evaluate the performance of wired LANs has been one of the important issues in this field.Network performance evaluation achieves three purposes[2]:The first one is to choose the most suitable and satisfactory one from the numerous schemes; the second one is to improve its defects and bottlenecks of the existing scheme; the third one is to predict the performance of the candidate system upon the reasonable configuration.So it is necessary to choose the appropriate indexes and establish the appropriate evaluation model for network performance evaluation.Zhang et al.[3] proposed an approach, which uses multiple indicators to evaluate the performance of the whole network.The method can compare the performance of different networks at different time, but the method for determining the weight of index was not mentioned in this paper.Mao et al.[4] proposed a method for determining the weight of index by employing fuzzy analytic hierarchy process, but the method is subjective and the evaluation process is complicated.Method based on historical data was proposed to determine the weight of index by Nan et al.[5].Network performance can be evaluated according to the health value of the network equipment.The above methods are all to evaluate the overall network performance.We need to focus more on some aspect of the network performance in some cases.Structural equation model (SEM) is a new type of multivariate statistical analysis method, which can analyze the relationship among dependent variables based on the large sample data.All kinds of network performances can be analyzed, such as invulnerability, effectiveness, survivability, safety and so on, as long as we get observable indicators.
There are three main topologies of wired LANs:ring network, star network and tree network.They are the basis of other complex topologies.So this paper uses SEM to evaluate effectiveness and invulnerability of the three networks.Effectiveness measures network performance in terms of dynamic network transmission ability, and invulnerability measures network performance in terms of static network topology.Firstly, it is necessary to calculate effectiveness and invulnerability of the entire network, and then, the contribution of the forwarding nodes to the entire network is calculated by deleting nodes or attacking links randomly.Next, according to the contribution of these nodes to the entire network in the effectiveness and invulnerability, the importance of these nodes can be judged comprehensively.Finally, the different monitoring and protection measures can be taken according to the importance of nodes.It can reduce the probability of network failure on the basis of the realization of network functions, and then reduce the cost of the entire network.
The research of this paper can be applied in many fields.The contribution of each type of weapon can be calculated in the military system network[6].We can choose proper kind and the number of weapons according to the combat environment, and the probability of winning a combat increases.When failure occurs in a network, nodes can be inspected according to the contribution of each node, and the bottleneck of the whole network can be predicted.We can employ an improved routing algorithm to reduce congestion when the network bottlenecks emerge.In addition, this method can be used in the traffic safety evaluation[7] and power network.
1 Basic Principle of SEMSEM is a statistical method that can analyze the relationship among variables based on the covariance matrix or correlation matrix of the variables.This method is originated from the path analysis, which was proposed by the geneticist Eswall Wright in the 1920s.It was originally used in psychology and sociology in the 1970s.It has become a new development direction in statistical analysis methods and been widely used in psychology, economics, sociology, military science[8] and other research fields.The basic idea is to find the correlation matrix (covariance matrix) of the model that has the smallest distance with the correlation matrix (covariance matrix) of the samples in all reasonable hypothesis models.First of all, we need to determine whether the model is identifiable after constructing SEM.Maximum likelihood function is the most commonly used fitting function in the model fitting.In the model assessment, we first need to examine whether the estimated parameters are appropriate.Secondly, the commonly used fitting indexes have to be examined to judge whether the model fitting degree can meet the requirements.The model modification will be necessary if there is an inappropriate value.In addition, choosing the proper samples also have an impact on the model evaluation to some extent.
There are four types of variables in SEM, including endogenous observable variables, endogenous latent variables, exogenous observable variables and exogenous latent variables[9].Endogenous variables are affected by other variables and exogenous variables can affect other variables.In other words, exogenous variables affect endogenous variables.Observable variables can be directly measured, such as the score of a subject, latent variables cannot be accurately and directly measured, such as intelligence, learning ability, family background and so on.There can be multiple latent variables in SEM.If there is no causal relationship among latent variables, endogenous latent variables are not included in the model.
Full model of SEM is divided into measurement model and structural model.The measurement model is used to study the relationship between observable variables and latent variables.The measurement equation is given as follows[10]
| $ \mathit{\boldsymbol{x}} = {\mathit{\boldsymbol{ \boldsymbol{\varLambda} }}_x}\mathit{\boldsymbol{\xi }} + \mathit{\boldsymbol{\delta }} $ | (1) |
| $ \mathit{\boldsymbol{y}} = {\mathit{\boldsymbol{ \boldsymbol{\varLambda} }}_y}\mathit{\boldsymbol{\eta }} + \mathit{\boldsymbol{\varepsilon }} $ | (2) |
where x is the vector of the exogenous observable variables; y is the vector of the endogenous observable variables; Λx is the factor loading matrix of exogenous observable variables on exogenous latent variables; Λy is the factor loading matrix of endogenous observable variables on endogenous latent variables; η is the vector of the endogenous latent variables; ξ is the vector of the exogenous latent variables; δ is the error term of the exogenous observable variable x; ε is the error term of the endogenous observable variable y.
Structural model is used to study the relationship among latent variables.The endogenous latent variables can be affected by the endogenous latent variables and the exogenous latent variables.So the structural equation can be shown as[10]
| $ \mathit{\boldsymbol{\eta }} = \mathit{\boldsymbol{B\eta }} + \mathit{\boldsymbol{ \boldsymbol{\varGamma} \xi }} + \mathit{\boldsymbol{\xi }} $ | (3) |
where Β represents the relationship among endogenous latent variables; Γ represents the effect of the exogenous latent variables on the endogenous latent variables; ζ is the residual term of the equation.It represents the part of η that is not explained by the equation.
In order to get unbiased estimators of the parameter, Eqs.(1)-(3) satisfy the following conditions[10]:
(1) E(δ)=0, E(ε)=0, E(ζ)=0;
(2) There is no relationship between the error terms ε, δ and the latent variables η, ξ;
(3) There is no relationship between ε and δ;
(4) There is no relationship between the residual term ζ and terms ξ, δ, ε.
At present, SEM can be analyzed by software.LISREL is one of the earliest and popular softwares.Currently, many other software products like EQS, AMOS and Mplus are also commonly used.
2 Selection of Evaluation IndexThe most important principle of the index selection is testability[11].The evaluation indexes need to be measured by simulation software.Next, the selected indexes can reflect the measured performance as much as possible.Finally, the selected indexes need to be tested by SEM.This paper evaluates the network performance in term of effectiveness and invulnerability.The corresponding evaluation indexes are described below.
2.1 Effectiveness evaluation indexEffectiveness indicates that how well the network meets business performance requirements under certain conditions[11].It is an important measure of network utilization efficiency.The research of the network aims to study the ultimate availability of the network.That is called effectiveness.At last, total delay, throughput, and packet loss rate are selected as the evaluation indexes of effectiveness in this paper according to the fitting indexes of the model.
Total delay is divided into transmission delay, propagation delay and queuing delay.The total delay T_Delay is given by Eq.(4).
| $ {\rm{T\_Delay = Delay\_1 + Delay\_2 + Delay\_3}} $ | (4) |
where Delay_1 is the transmission delay, which deals with the time of data packets reaching the link from the sending node.It is given by Eq.(5).
| $ {\rm{Delay\_1 = Packet\_Length/Send\_Rate}} $ | (5) |
where Packet_Length is the total length of the data packets that are sent, and Send_Rate is the transmission rate.Delay_2 is the propagation delay, which is the time required to receive from the first packet to the last.It depends on the length of the link and the transmission medium; Delay_3 is the queuing delay, which is the time between the receipt of packets and the transmission of packets.It depends on the queue length and scheduling policy.
Throughput is the number of packets received and transmitted by two nodes in the network per unit time.The throughput T_put is implemented by Eq.(6).
| $ {\rm{T\_put = Send + Receive}} $ | (6) |
where Send is the number of packets transmitted per unit time; Receive is the number of packets received per unit time.
Packet loss rate is the probability of data packet losses when packets are sent between the sending node and the receiving node.The packet loss rate L_R is implemented by Eq.(7).
| $ {\rm{L\_R = 1-Receive/Send}} $ | (7) |
Invulnerability describes the reliability of the network under a certain strategy of attack[12].We select nodes attacking and links attacking as the attack strategy.The nodes attacking is to remove some nodes in the network randomly and the links attacking is to attack some links in the network randomly.At last, average degree[13] and average clustering coefficient[14] are selected as the evaluation indexes of invulnerability in this paper according to the fitting indexes of the model.
Complex networks can be represented by unweighted diagram G=(V, E), where V represents the node set; E represents the edge set.Let M=|V|, the average degree DG is implemented by Eq.(8).
| $ {\rm{DG}} = \frac{1}{M}\sum\limits_{i = 1}^M {d\left( i \right)} $ | (8) |
where d(i) is the degree of node i.
The average clustering coefficient CC is implemented by Eq.(9).
| $ {\rm{CC}} = \frac{1}{M}\sum\limits_{i = 1}^M {\frac{{2{E_i}}}{{d\left( i \right)\left( {d\left( i \right)-1} \right)}}} $ | (9) |
where node i and its neighboring nodes form a cluster; Ei represents the number of edges in the cluster.
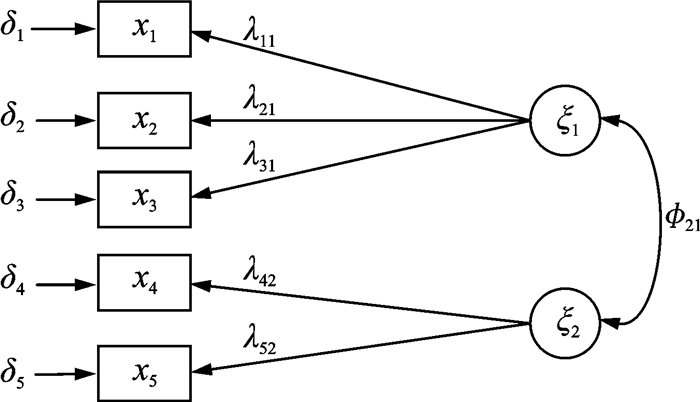
3 Modeling and Evaluation of Wired LANs PerformanceAccording to the evaluation indexes of network performance and the principle of SEM, the evaluation model is established as shown in Fig. 1, and Table 1 is the corresponding variable table.There are five exogenous observable variables, two exogenous latent variables and eleven variables that need to be estimated.According to t-rule, we have t=11 < p*(p+1)/2 =15, so the SEM can be identified.
|
Fig. 1 SEM of network performance evaluation |
| Table 1 Variable table of SEM |
In this paper, the effectiveness and invulnerability are selected as two exogenous latent variables because there is no obvious causal relationship between them.The relevant contribution indexes are served as the exogenous observable variables.The mathematical model between exogenous latent variables and exogenous observable variables is constructed by the contribution coefficient λ and the deviation of contribution δ.Such as effectiveness ξ1 is represented by the throughput x1, the contribution coefficient λ11 and the deviation of the contribution δ1.It also can be expressed by the total delay x2, the contribution coefficient λ21 and the deviation of the contribution δ2.It can still be expressed by the packet loss rate x3, the contribution coefficient λ31 and the deviation of the contribution δ3.Similarly, invulnerability ξ2 is represented by the average degree x4, the contribution coefficient λ42 and the deviation of the contribution δ4.It also can be expressed by the average clustering coefficient x5, the contribution coefficient λ52 and the deviation of the contribution δ5.In addition, the relationship between the exogenous latent variables in Fig. 1 is rather complicated, so this paper does not focus on it.We need maximum likelihood function FML=tr(ΣΣ-1(θ))+log|Σ(θ)|-log|Σ|-p to estimate these key parameters, where Σ(θ) is the covariance matrix of the model; Σ is the covariance matrix of the samples; p is the order of the covariance matrix.The estimated value
Measurement equation of the model is given by Eq.(10).
| $ \left[{\begin{array}{*{20}{l}} {{x_1}}\\ {{x_2}}\\ {{x_3}}\\ {{x_4}}\\ {{x_5}} \end{array}} \right] = \left[{\begin{array}{*{20}{l}} {{\lambda _{11}}}&0\\ {{\lambda _{21}}}&0\\ {{\lambda _{31}}}&0\\ 0&{{\lambda _{42}}}\\ 0&{{\lambda _{52}}} \end{array}} \right]\left[{\begin{array}{*{20}{c}} {{\xi _1}}\\ {{\xi _2}} \end{array}} \right] + \left[{\begin{array}{*{20}{l}} {{\delta _1}}\\ {{\delta _2}}\\ {{\delta _3}}\\ {{\delta _4}}\\ {{\delta _5}} \end{array}} \right] $ | (10) |
Based on equivalent transformation of the equations, the quantitative relationship model between effectiveness, invulnerability and contribution indicators is shown by Eqs.(11), (12).
| $ \begin{array}{l} {\xi _1} = \left( {\frac{1}{{3{\lambda _{11}}}}{x_1} + \frac{1}{{3{\lambda _{21}}}}{x_2} + \frac{1}{{3{\lambda _{31}}}}{x_3}} \right)-\\ \left( {\frac{1}{{3{\lambda _{11}}}}{\delta _1} + \frac{1}{{3{\lambda _{21}}}}{\delta _2} + \frac{1}{{3{\lambda _{31}}}}{\delta _3}} \right) \end{array} $ | (11) |
| $ {\xi _2} = \left( {\frac{1}{{2{\lambda _{42}}}}{x_4} + \frac{1}{{2{\lambda _{52}}}}{x_5}} \right)-\left( {\frac{1}{{2{\lambda _{42}}}}{\delta _4} + \frac{1}{{2{\lambda _{52}}}}{\delta _5}} \right) $ | (12) |
In this way, if observable variables x1-x5 can be obtained easily, the values of ξ1 and ξ2 can be calculated.The effectiveness and invulnerability of the network are divided into "very good""better""medium""worse", and "very bad".The corresponding evaluation intervals are (0.85, 1], (0.6, 0.85], (0.40, 0.60], (0.15, 0.40] and (0, 0.15].
The contribution of all the forwarding nodes to the network in terms of effectiveness and invulnerability can be calculated by deleting nodes.Meanwhile, the contribution of effectiveness and invulnerability can be sequenced.
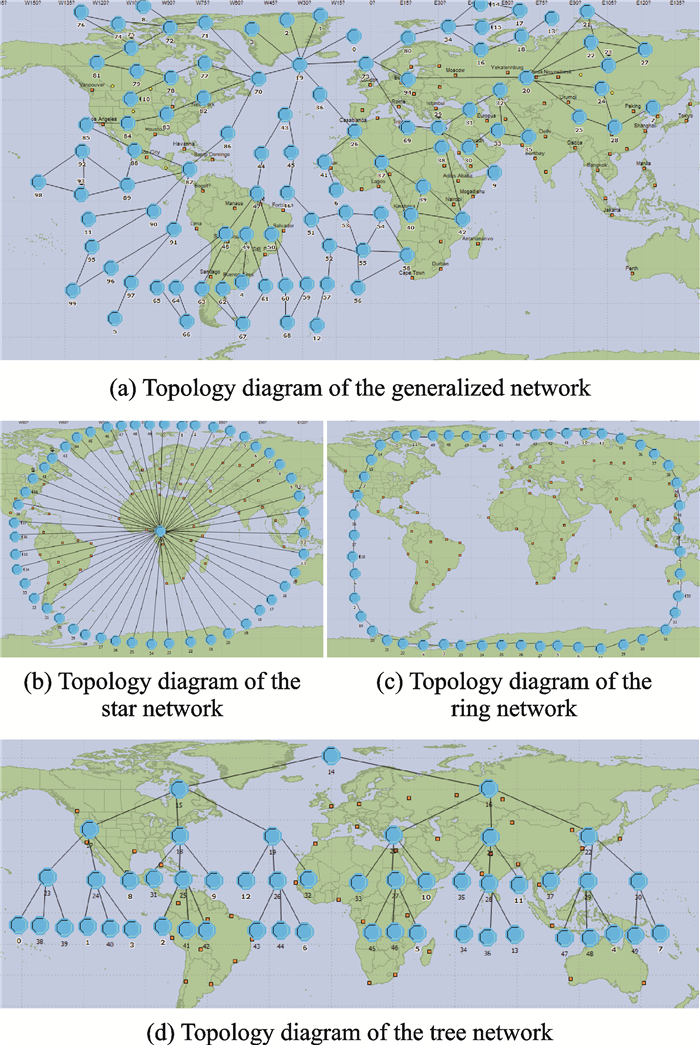
4 SimulationIn order to make the evaluation data close to the real network, the network simulation software OPNET14.5 is used to build network topology and get simulation data[15-17].The topology diagram of the networks is shown in Fig. 2.This experiment selects a generalized network with 100 nodes.Other networks consist of 50 nodes.
|
Fig. 2 Topology diagram of the networks |
The generalized network is used to obtain parameters in the model and other networks are used to verify the rationality of the model by comparing the simulation data.The nodes in the network can be divided into leaf nodes and forwarding nodes.The leaf nodes have the function of sending and receiving data packets and the forwarding nodes have the function of forwarding packets.The thick solid lines of connected nodes in Fig. 2 represent the links among the nodes.The address of the next hop is determined by setting a routing table in the forwarding node.This article sets up 14 leaf nodes and every two leaf nodes compose one link.The matching table is shown in Table 2.
| Table 2 Communication relationship of leaf nodes |
Input the example of performance evaluation of SEM into LISREL8.70, in which the maximum likelihood estimation method is used to estimate the parameters.The estimated values and significance testing (t-test) values of 11 parameters are shown in Table 3.The values of the main fitting index are shown in Table 4.
| Table 3 Estimated values and t-test values of SEM |
| Table 4 Values of the main fitting index |
From Tables 3, 4, we can see that parameter estimation based on SEM is reasonable.The values of the main fitting index must be verified in SEM.The fitting of the model is good when RMSEA is less than 0.05[18].When the values of NFI, NNFI and CFI are all greater than 0.9[19-20], it means that the model is acceptable.Therefore, the SEM in this paper is a suitable model.According to the estimated values of parameters, the quantitative relationship between effectiveness, invulnerability and the contribution index can be shown as
| $ \begin{array}{l} {\xi _1} = 0.355{x_1} + 0.333{x_2} + 0.333{x_3}-0.039\\ {\xi _2} = 0.575{x_4} + 0.617{x_5}-0.354 \end{array} $ |
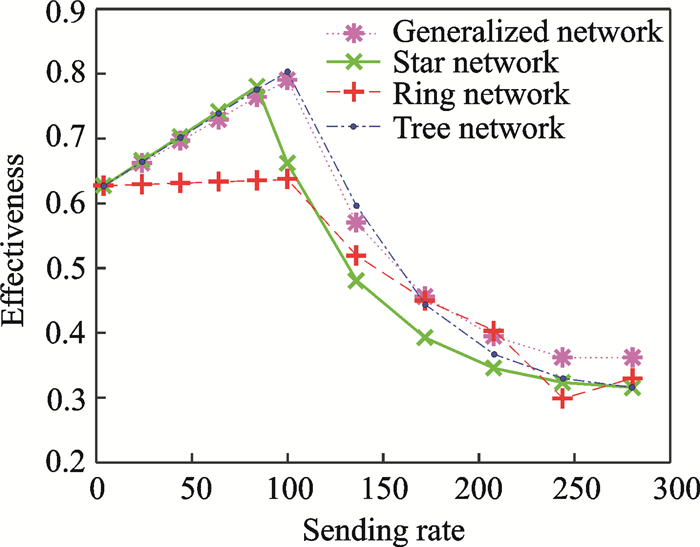
After the model is constructed, it is necessary to analyze the relationship between the sending rate and effectiveness.The relationship between the sending rate and effectiveness is shown in Fig. 3.From it, we can know that the effectiveness increases with the increasing of sending rate at first.While, the effectiveness of all networks suffers a drop through to various degree when the sending rate is more than 100.And the effectiveness of star network decreases most greatly with the increase of the sending rate. Besides, effectiveness can be predicted according to the sending rate with in proper range.
|
Fig. 3 Relationship between the sending rate and effectiveness (normalized values) |
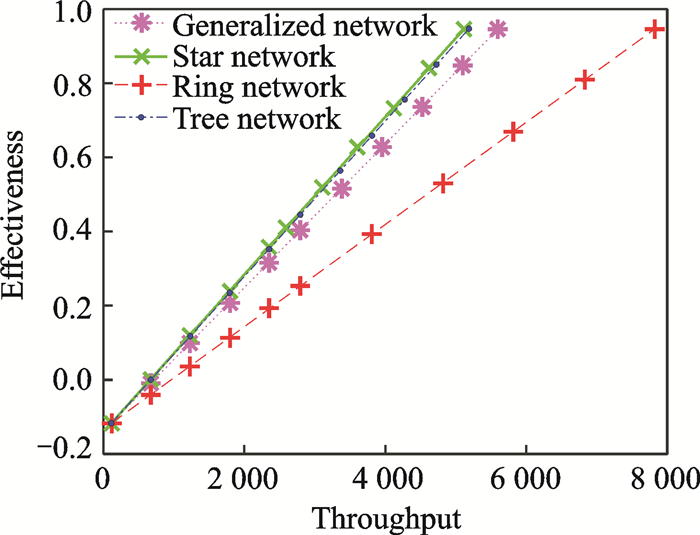
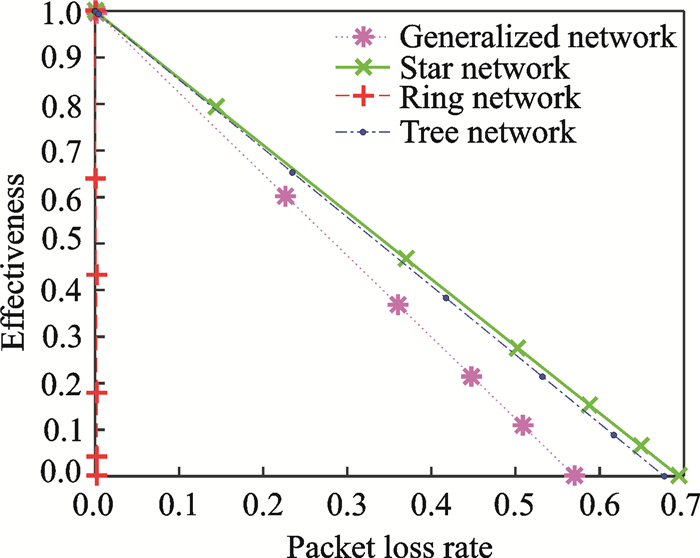
In order to analyze the main affecting factors of the effectiveness, the relationship between the affecting factors and effectiveness will be discussed in Figs. 4-6.
|
Fig. 4 Relationship between the throughput and effectiveness (normalized values) |

|
Fig. 5 Relationship between the total delay and effectiveness (normalized values) |
|
Fig. 6 Relationship between the packet loss rate and effectiveness (normalized values) |
From Fig. 4, we can see that the effectiveness increases with the throughput.The throughput of the ring network is the largest if the effectiveness is the same, while the throughput of the star network is the smallest.
From Fig. 5, we can see that the effectiveness decreases with the total delay.The total delay of the star network is the largest if the effectiveness is the same, while total delay of the ring network is the smallest.
From Fig. 6, we can know that the effectiveness decreases with the packet loss rate.The packet loss rate of the star network is the largest if the effectiveness is the same, while the packet loss rate of the ring network is the smallest.
Overall, the result of evaluation is similar to actual circumstance.The star network only has one forwarding node, so it is easy to congest especially when the sending rate becomes large.For ring network, a forwarding node only affects a link, so packets can be transmitted normally in general.
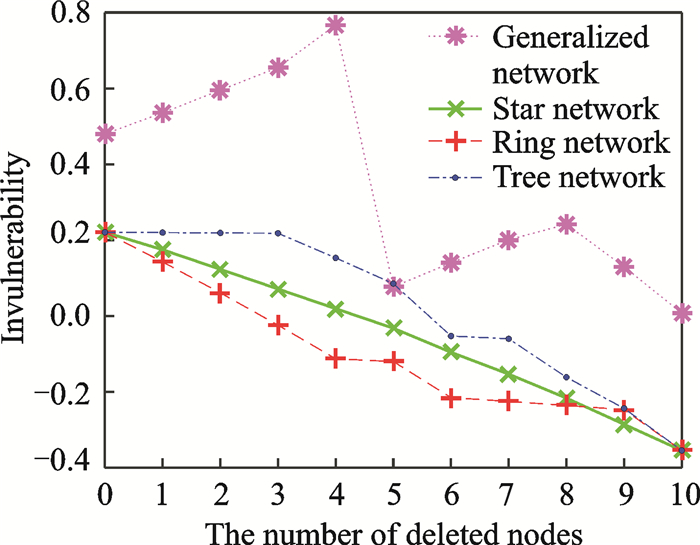
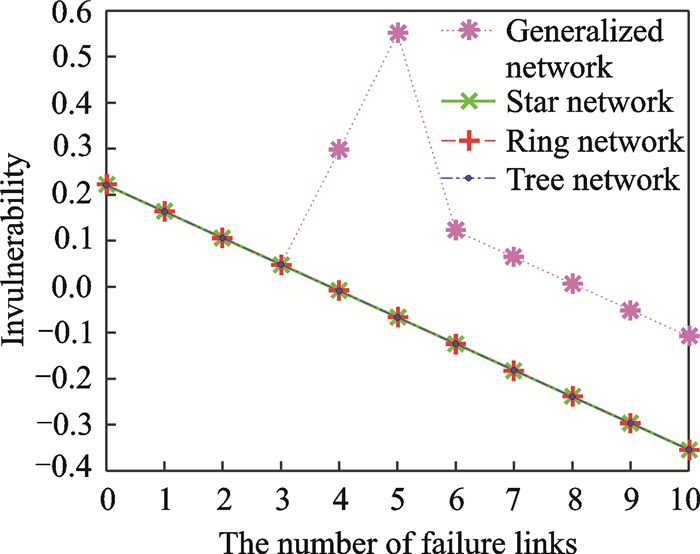
To detect the invulnerability of the different networks, we remove some nodes or attack some links randomly.The relationship between the number of the deleted nodes and invulnerability is shown in Fig. 7 and the relationship between the number of the failure links and invulnerability is shown in Fig. 8.
|
Fig. 7 Relationship between the number of deleted nodes and invulnerability (normalized values) |
|
Fig. 8 Relationship between the number of failure links and invulnerability (normalized values) |
From Figs. 7, 8, we can conclude that the invulnerability of the general network is higher than other networks mainly because the average clustering coefficient of other networks equals to 0.In the general network, there are some points whose invulnerability change is acute, that is mainly because deleting these nodes has large impact on the average degree and the average clustering coefficient.In other networks, however, the invulnerability decreases with the increase of the number of the deleted nodes.The reason is that the invulnerability of those networks all depends on the average degree.And the more nodes are deleted, the faster the average degree decreases.From Fig. 8, we can know that the invulnerability of star network, ring network and tree network is the same mainly because the degree of those networks decreases by 2 when a link gets some faults.
We calculate the contribution of all the forwarding nodes to the entire network in terms of effectiveness and invulnerability when the sending rate is set as 5.For star network, unique forwarding node has an important role in transmitting data packets.The whole network will break down if the forwarding node malfunctions.For ring network, the contribution of all the forwarding nodes in invulnerability is the same.The removal of any forwarding node only affects the reception of data packets of one link, so the difference of the contribution in effectiveness among all the forwarding nodes is very small.For tree network, the contribution of the top six nodes to the entire network in terms of effectiveness and invulnerability is shown in Tables 5, 6.
| Table 5 Node contribution of tree network in effectiveness |
| Table 6 Node contribution of tree network in invulnerability |
From Table 5, we can know that Node 15 has the greatest contribution in effectiveness.The deletion of the Node 15 will affect the reception of data packets of six links.The deletion of the Node 16 will affect the reception of data packets of five links.The deletion of the Node 14 and Node 17 will affect the reception of data packets of four links.The reception of data packets of two links will be affected when Node 22 and Node 24 are deleted.From Table 6, we can see that the contribution of all the forwarding nodes in invulnerability is the same.
For generalized network, this paper lists the contribution of some nodes to the entire network in terms of effectiveness and invulnerability.Due to limited space, contribution of the top six nodes in effectiveness and invulnerability is shown in Tables 7, 8.
| Table 7 Node contribution of generalized network in effectiveness |
| Table 8 Node contribution of generalized network in invulnerability |
From Table 7, we can know that Node 19 has the greatest contribution in effectiveness.The deletion of the Node 19 will affect the reception of data packets of six links.Therefore, the Node 19 plays a crucial role in the entire network.The deletion of the Node 73 will affect the reception of data packets of three links.The reception of data packets of two links will be affected when Node 86, Node 43 and Node 87 are deleted.All these show that the more links affected by the deleted node are, the greater the contribution of the node becomes.
It can be seen from Table 8 that the contribution of the forwarding nodes to the network is not particularly large in terms of invulnerability because the structural change of the entire network is not particularly large with removing a node.
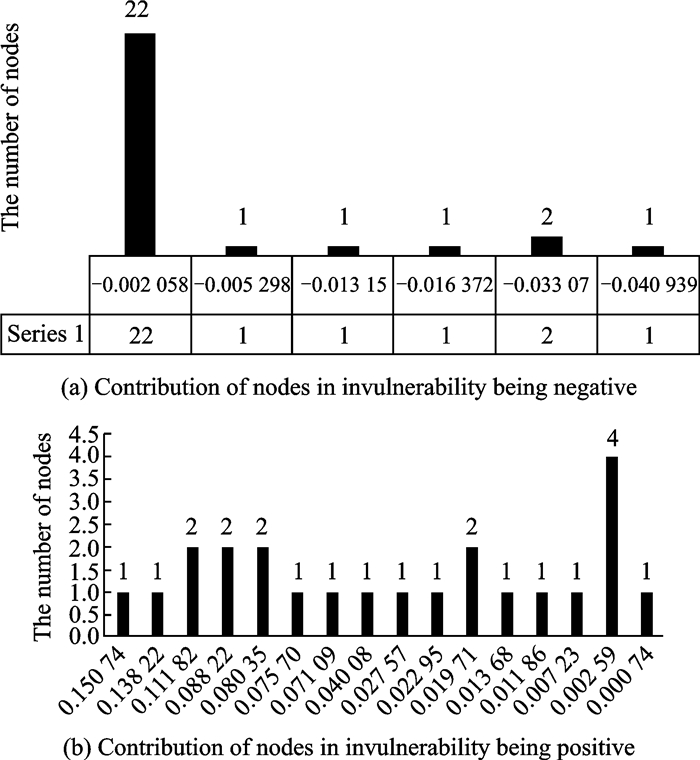
Some nodes do not play the role of forwarding data packets in the generalized network, so the contribution of effectiveness is zero.But whether these nodes can be removed depends on whether the invulnerability of the network will increase by deleting the corresponding node.The relationship between the contribution of nodes in invulnerability and the number of nodes are shown in Fig. 9 when the contribution of these nodes in effectiveness is zero.
|
Fig. 9 Relationship between the contribution of nodes in invulnerability and the number of nodes |
It is known from the experiment and analysis that there are 51 nodes which have no contribution to the network in effectiveness.But there are 23 nodes (Fig. 9(b)) which reduce the invulnerability of the network after the deletion of those nodes.These results show that there are 28 nodes (Fig. 9(a)) which can be deleted in the general network designed in this paper.
5 ConclusionsThe key of the network performance evaluation is to establish a quantitative relationship model between latent variables and observable variables, and the research on this issue relies heavily on the quality of the evaluation data.The latent variables selected in this paper have effectiveness and invulnerability.And then we need to determine observable variables according to latent variables.Due to the complexity of the network and the impact among contribution indexes, the existing methods of the network performance evaluation still lag behind the practical application.The work in this paper can only be regarded as a useful attempt to apply the SEM.It is also necessary to select the appropriate latent variable according to the actual network situation.Other latent variables can be added to evaluate the network performance.By this way, the network performance evaluation will be more realistic and reliable.
Acknowledgements
This work was supported by the National Natural Science Foundations of China (Nos.61572435, 61472305, 61473222), the Ningbo Natural Science Foundations (Nos.2016A610035, 2017A610119), the Complex Electronic System Simulation Laboratory (No.DXZT-JC-ZZ-2015-015), and the Joint Fund of China State Shipbuilding Corporation (No.6141B03010103).
| [1] |
TANENBAUM A S, WETHERALL D J. Computer networks[M]. 5th ed. Beijing: Tsinghua University Press, 2015. (in Chinese)
|
| [2] |
LIN C. Performance evaluation of computer networks and computer systems[M]. Beijing: Tsinghua University Press, 2001. (in Chinese)
|
| [3] |
ZHANG D Y, HU M Z, ZHANG H L. Study on network performance evaluation method based on measurement[J]. Journal on Communications, 2006, 27(10): 74-79. (in Chinese) |
| [4] |
MAO L, QI D Y. A dynamic network performance evaluation method based on multi-dimensional measurement[J]. Computer Engineering & Science, 2014, 36(11): 2106-2113. (in Chinese) |
| [5] |
NAN Y, CHEN L. Performance evaluation method based on objective weight determination for data center network[J]. Journal of Computer Applications, 2015, 35(11): 3055-3058. (in Chinese) |
| [6] |
LUO X M, HE R, ZHU Y L. Research on evaluation of contribution to weapon equipment system architecture[J]. Journal of Academy of Armored Force Engineering, 2016, 30(4): 1-6. (in Chinese) |
| [7] |
KIM T H, SHIN Y C, LIM S J, et al. An empirical study of influence relationship on traffic culture index (TCI) utilizing PLS-SEM (structural equation modeling)[J]. BMC Public Health, 2013, 28(2): 78-83. |
| [8] |
LUO X M, ZHU Y L, HE R. SEM-based evaluation method of contribution to system warfighting for weapons and equipments[J]. Journal of Equipment Academy, 2015, 26(5): 1-6. (in Chinese) |
| [9] |
YI D H. Structural equation model:Methods and applications[M]. Beijing: China Renmin University Press, 2008. (in Chinese)
|
| [10] |
HAU K T, WEN Z L, CHENG Z J. Structural equation model and its applications[M]. Beijing: Educational Science Publishing House, 2004. (in Chinese)
|
| [11] |
YANG X P, YIN C H. Research of reliability indexes of complex network[J]. Journal of Beijing Information Science & Technology University, 2010, 25(3): 92-96. (in Chinese) |
| [12] |
WU J, TAN Y J. Study on measure of complex network invulnerability[J]. Journal of Systems Engineering, 2005, 20(2): 128-131. (in Chinese) |
| [13] |
WU J, TAN S Y, TAN Y J, et al. Analysis of invulnerability in complex networks based on natural connectivity[J]. Complex Systems & Complexity Science, 2014, 11(1): 77-86. (in Chinese) |
| [14] |
WU Z, LIN Y, WANG J, et al. Link prediction with node clustering coefficient[J]. Physica A Statistical Mechanics & Its Applications, 2016, 452: 1-8. |
| [15] |
KHADIM R, ERRITALI M, MAADEN A. Performance study of IEEE 802154 under OPNET modeler for wireless sensor networks[J]. Telkomnika Indonesian Journal of Electrical Engineering, 2015, 16(1): 98-105. |
| [16] |
LI X, PENG M, CAI J, et al. OPNET-based modeling and simulation of mobile Zigbee sensor networks[J]. Peer-to-Peer Networking and Applications, 2016, 9(2): 414-423. DOI:10.1007/s12083-015-0349-8 |
| [17] |
DAVID N, ANYAKOHA C, AGBO H. Based simulation for rural educational ICT connectivity[J]. International Journal of Scientific & Engineering Research, 2016, 7(4): 1499-1504. |
| [18] |
SCHUBERT A L, HAGEMANN D, VOSS A, et al. Evaluating the model fit of diffusion models with the root mean square error of approximation[J]. Journal of Mathematical Psychology, 2017, 77: 29-45. DOI:10.1016/j.jmp.2016.08.004 |
| [19] |
ZHANG J, WANG C, LAMBERT R, et al. Validity evidence for the Chinese version classroom appraisal of resources and demands (CARD)[J]. Psychology in the Schools, 2017, 54(9): 1079-1093. DOI:10.1002/pits.2017.54.issue-9 |
| [20] |
HEIDARZADEH M, NASERI P, SHAMSHIRI M, et al. Evaluating the factor structure of the Persian version of posttraumatic growth inventory in cancer patients[J]. Asian Nursing Research, 2017, 11(3): 180-186. DOI:10.1016/j.anr.2017.07.003 |
 2018, Vol. 35


