2. College of Aerospace Engineering, Nanjing University of Aeronautics and Astronautics, Nanjing 210016, P. R. China
The design of high lift devices has always been the key part of aircraft design which has significant impacts on aircraft performances during taking off and landing, as well as on the safety and economy of aircraft. In terms of aerodynamic design, it demands high performances of taking off and landing based on high speed cruise configuration with respecting the structure constraints. In terms of aero-acoustics, during taking off and landing, the operation of high lift devices will have great effects on the noise level of aircraft. The sources of noise will be generated in the complicate flow in the slot, the mixture wakes in different airfoil sections, the flow in the internal of cavity, the separation of flow in boundary layer, and vortexes, etc. Especially due to the slot and the cavity, unsteady flow becomes violent, leading to the main source of aeroacoustics[1].
The conventional design of high lift devices has not considered aero-acoustic influences. On the one hand, the computational fluid dynamic(CFD), computational aero-acoustics(CAA) technologies cannot provide sufficient support for it. On the other, adequate awareness of aero-acoustic effects has not been integrated inconventional design concept. However, with the CFD, CAA developing, and more concentration on aeroacoustics of high lift devices, it is more and more urgent to propose a new way to design high lift devices by incorporating both aerodynamics and aeroacoustics based on the conventional devices design. In this aspect, researchers of Airbus have researched and applied CAA in high lift devices design[2]. This paper aims to propose the multi-element airfoil aerodynamics and aero-acoustics optimization using numerical methods. Meanwhile, various slot parameter influences on noise are analyzed.
1 MethodologyAerodynamics analysis is the basis of aero-acoustics research, and the aerodynamic performances of high lift devices analysis is the premise of comprehensive aero-acoustics optimization design, while the pressure fluctuation computing in the flow field around high lift devices is the first step of aero-acoustics CAA computation. In this section, the computational method for steady aerodynamics is introduced briefly.
1.1 Multi-element airfoil design and aerodynamic computationMulti-element airfoil aerodynamic design, analysis and optimization can be done with steady aerodynamics computational method that demands high efficiency and reliability. Generally, solving the Reynolds average Navier-Stokes(RANS) equations can satisfy the engineering requirement. Empirically, as for the research of multi-element airfoil design and aerodynamic computation, the approach MSES based on Euler equations is used to analyze multi-element airfoils aerodynamics. MSES was developed by Prof. Mark Drela of MIT to analyze the aerodynamics and shape optimization of multi-element airfoils[3-4]. This approach has been applied successfully in several designs of high lift devices, which has accumulated useful data and rectification experiences.
1.2 Unsteady flow field computation of multi-element airfoilThe unsteady Navier-Stokes equation can be expressed as
| $ \frac{{\partial \mathit{\boldsymbol{U}}}}{{\partial t}} + \frac{{\partial \mathit{\boldsymbol{E}}}}{{\partial x}} + \frac{{\partial \mathit{\boldsymbol{F}}}}{{\partial y}} + \frac{{\partial \mathit{\boldsymbol{H}}}}{{\partial z}} = \frac{{\partial {\mathit{\boldsymbol{E}}_{\rm{v}}}}}{{\partial x}} + \frac{{\partial {\mathit{\boldsymbol{F}}_{\rm{v}}}}}{{\partial y}} + \frac{{\partial {\mathit{\boldsymbol{H}}_{\rm{v}}}}}{{\partial z}} $ | (1) |
where U is the conservative variable vector. E, F, H are the inviscid flux vector and Ev, Fv, Hv the viscid flux vector.
For the spatial discretion, the sixth-order accuracy of finite difference[5] is showed as Eq.(2) for the first derivative
| $ \begin{array}{l} \frac{1}{3}{\left( {\frac{{\partial f}}{{\partial h}}} \right)_{j - 2}} + {\left( {\frac{{\partial f}}{{\partial h}}} \right)_j} + \frac{1}{3}{\left( {\frac{{\partial f}}{{\partial h}}} \right)_{j + 1}} = \\ \frac{1}{9}\frac{{{f_{j + 2}} - {f_{j - 2}}}}{{4h}} + \frac{{14}}{9}\frac{{{f_{j + 1}} - {f_{j - 1}}}}{{4h}} \end{array} $ | (2) |
where h is the mesh interval.
For the time discretion, the implicit marching time scheme is adopted.
| $ \frac{{4{Q^{n + 1}} - 3{Q^n} + 2{Q^{n - 1}}}}{{3\Delta t}} = R $ | (3) |
And
| $R = {\left( {\frac{{\partial \mathit{\boldsymbol{F}}}}{{\partial \xi }} + \frac{{\partial \mathit{\boldsymbol{G}}}}{{\partial \eta }} + \frac{{\partial \mathit{\boldsymbol{H}}}}{{\partial \zeta }}} \right)^n} + {\left( {\frac{{\partial {\mathit{\boldsymbol{F}}_{\rm{v}}}}}{{\partial \xi }} + \frac{{\partial {\mathit{\boldsymbol{G}}_{\rm{v}}}}}{{\partial \eta }} + \frac{{\partial {\mathit{\boldsymbol{H}}_{\rm{v}}}}}{{\partial \zeta }}} \right)^n} $ | (4) |
The lower-upper symmetric Guss-seidel (LU-SGS)[6] is used as the iterative method for the above equation solutions.
Due to the complexity of high lift wing configuration, and that of flow around the devices, it is necessary to apply the CFD computational method with more precision and more appropriate turbulence model such that the quality and reliability of unsteady flow field information can be guaranteed for aero-acoustics analysis. For most engineering applications, the approach of RANS equations is applied. The idea behind the equations is Reynolds decomposition, whereby an instantaneous quantity is decomposed into its time-averaged and fluctuating quantities. Therefore, the time-averaged terms can be solved by N-S, while the fluctuating terms are obtained by applying turbulence model. The fact that instantaneous characters and different scale fluctuations can hardly be revealed makes it difficult to deal with the aero-acoustics problems by captureing details of flow field. Moreover, the approach of DNS cannot be applied in practice. Thus, a compromise called large eddy simulation (LES) is adopted. The ideas is to treat the vortex greater than local grid with N-S equations directly, and to simulate the vortex in small scale by SubGrid-Scale (SGS) model.
Three-dimensional compressible N-S equations in conservative form and the implicit LES (ILES) method are applied in this paper[7-8]. To guarantee the reliability of ILES, a high precision scheme is applied for low dissipation and low dispersion, including the sixth-order accuracy compact scheme to solve convection terms, the six th-order center scheme to solve dissipation terms, and the 2nd LU-SGS method for time marching.
First, the averaged flow field solution is obtained by S-A turbulence model. Second, the unsteady flow field can be simulated further by means of unsteady implicit large eddy simulation. After the flow field evolves periodically, data can be stocked for time average, statistical and spectrum analysis.
1.3 FW-H integral method for aero-acoustic analysisHere, FW-H integral method[9] is used to calculate noise radiation in the far field. The equations of FW-H are derived from original aerodynamics equations. These equations are extended by using the generalized function with taking effects of the solid boundary condition into account.
Ffowcs Williams and Hawkings[9] utilized the generalized function theory to obtain the classic equation associated with their names. The FW-H equation can be written as the following inhomogeneous wave equation
| $ \begin{array}{l} \frac{1}{{{c^2}}}\frac{{\partial^2 p\prime \left( {x, t} \right)}}{{\partial {t^2}}} - {\nabla ^2}p\prime \left( {x, t} \right) = \\ \frac{\partial }{{\partial t}}[({\rho _0}{U_n})\delta \left( f \right)] - \frac{\partial }{{\partial {x_i}}}[{L_i}\delta \left( f \right)] + \\ \frac{{{\partial ^2}}}{{\partial {x_i}\partial {x_j}}}[{T_{ij}}\delta \left( f \right)] \end{array} $ | (5) |
where the three terms on the right-hand side are monopole, dipole and quadrupole sources, respectively (from left to right).
The far field solution of FW-H equation can be written as
| $ \begin{array}{l} \frac{1}{{{c^2}}}4{\rm{ \mathsf{ π} }}p{\rm{ }}\prime = \int_{f = 0} {} {\left[ {\frac{{{\rho _{0}}({{\dot U}_{n}} + {\rm{ }}{U_{\dot n}}_)}}{{r{{(1 - M{a_{{\rm{r}}}})}^2}}}} \right]_{{\rm{ret}}}}{\rm{d}}S + \\ \int_{f{\rm{ }} = {\rm{ }}0} {} {\left[ {\frac{{{\rho _0}{U_{n}}[r\dot M{a_{\rm{r}}}{\rm{}} + {\rm{ }}c(M{a_{\rm{r}}}{\rm{}} - M{a^2})]}}{{{r^2}{{(1 - M{a_{{\rm{r}}}})}^3}}}} \right]_{\rm{}}}_{{\rm{ret}}}{\rm{d}}S \end{array} $ | (6) |
where Ma is the Mach number vector at a source point on the integration surface, dots on the quantities denotes time derivative with respect to the source time.
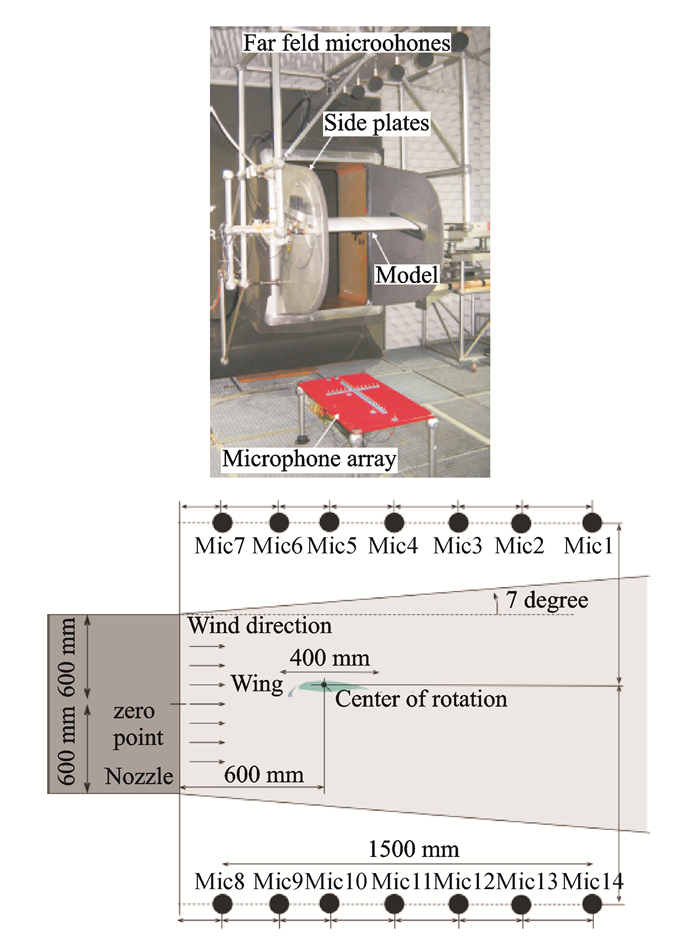
2 TestThe model of Ref.[10] is adopted for validating the above method. It was carried out in a German research project FREQUENZ, as shown in Figs. 1, 2. The project has conducted a series of experiments to provide detailed data for high lift devices and aeroacoustics numerical research. To insulate the noise from slat, this model comprises only slat and main wing (Flaps up). Model scale is 1:7.5. The wind tunnel is 1.2 m high and 0.8 m wide; the span of the test model is 0.8 m; the chord 0.4 m; and the slot angle 26°.

|
Fig. 1 FREQUENZ two-element airfoil configuration[10] |
|
Fig. 2 FREQUENZ model in wind tunnel[10] |
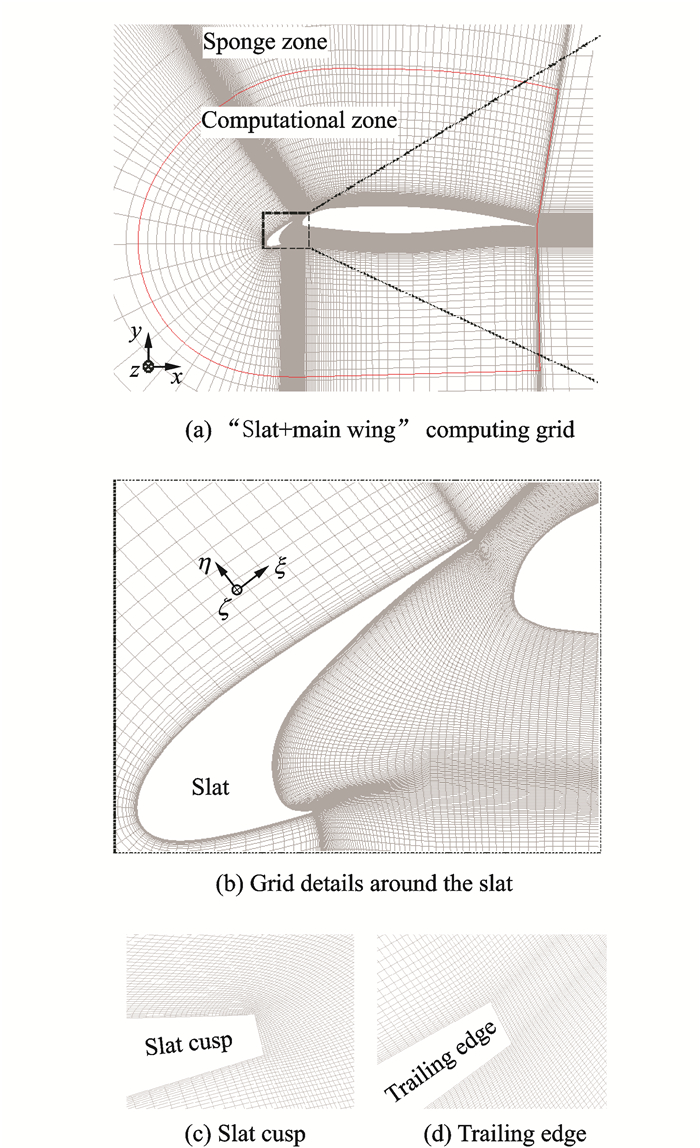
The computation is carried out on structured grids using the above method. The grids consist of 7 blocks. The total number of grid is about 27 millions. The biggest mesh scale in the computing domain is 0.02 chord length (C). The outer far field is located in around 100C away from the body face. 40 grid points are set between the body face and outer far field to avoid the reflection of noise from far field. In the slat cavity region, 208 grid points are set on the lower airfoil surface, while 200 grid points are set on the upper surface. The normal distance of the first layer is 2×10⁻⁵C. 170 grid points are arranged in the slot between the slat and the main wing; the spanwise thickness is 0.035C(≈0.3C s), where 71 grid points are evenly distributed. The computation mesh is shown as Fig. 3.
|
Fig. 3 Fig. 3 Grids for aerodynamic and aero-acoustic computing |
All solid wall surfaces are set as no slip boundary condition. The far field condition is set as zero-gradient of pressure and non-free turbulence. The periodic boundary condition is applied in the spanwise direction for ILES computation.
Here the flow condition is: Ma=0.16, α=13°. The chord length of slot (Cs) is 0.12 chord length of main wing(C), of which the trailing edge is 7×10⁻⁴ C. ReC=1.4×10⁶. For MPI parallel computing 48 CPU cores are used, and the result of one unsteady case can be obtained spending 48 h.
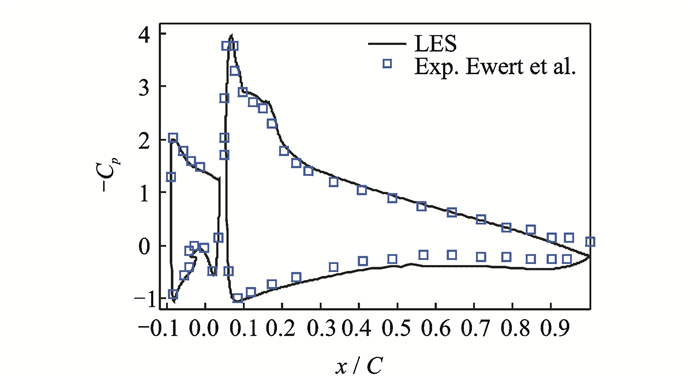
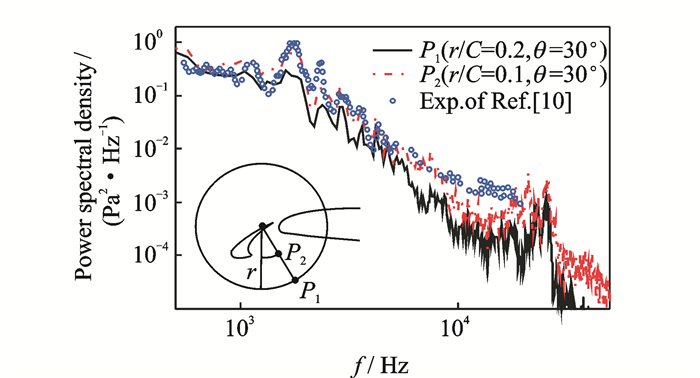
Fig. 4 is the compared results between computation and experiment. The computation results coincide well with those of experiment, especially in the region between the slat and the main wing where complex flow is located, which proves the above method has quite good accuracy for this type of aerodynamics numerical simulation. Fig. 5 shows power spectral density (PSD) compared results between numerical computation and experiment. It also validated that the above method for CAA has good precision. In this case, the power spectral density of pressure fluctuation is extracted at P1(r=0.1, θ=30°) and P2(r=0.2, θ=30°), while computation value is extracted from x-y plane in the instantaneous flow field. However, Ref.[10] does not offer the exact PSD value. To analyze and compare them, the data are extrapolated from the existent missing detailed data test curve. Then these data are rectified by the amplitude-frequency response, such that the tendency is logical. From Fig. 5, the low frequency narrowband noise is observed below 2 kHz, which coincides well with the computational results. The second narrowband noise with the largest amplitude is the main perturbing source. The numerical simulation and test data coincide well below the frequency of 8 kHz. In computing, the high frequency narrow band noise emerges at 25 kHz, which is different from the test results in 2007. This test did not observe the high frequency narrowband noise, since the measure concerning the boundary layer transition has inhibitive effects.
|
Fig. 4 Comparison of pressure coefficient between computation and test |
|
Fig. 5 Comparison of PSD between computation and test |
All the results show that the above introduced CFD and CAA methods have reliable and reasonable performances on flow field analysis and aeroacoustics analysis. Therefore, these methods can be applied in the slat aero-acoustic mechanism analysis and in slat comprehensive aerodynamic/aero-acoustic optimization.
3 Aerodynamic/Aero-acoustic Optimization ProcessBasic configuration of multi-element airfoil design is based on a supercritical airfoil, as shown in Fig. 6.

|
Fig. 6 Basic configure of multi-element airfoil |
In accordance with design requirements, there are six control parameters arranged in the basic airfoil to control the flap or slat's chord length, the leading edge radius, the maximum thickness, and the smoothing with the main wing. These control points also control the shape of flap or slat by means of the elliptical equation and the cubic equation. With the help of CFD computational tools (MSES mainly), the slot shape can be constructed from the analysis of pressure distribution. One can determine a preliminary slat parameter according to requirements of the maximal lift coefficient, the obliqueness of slat, and the statistical data of slat as well. The constructed model of multi-element airfoil is shown in Fig. 7.

|
Fig. 7 Two-element airfoil with slat and main wing |
Since much time is spent to compute the noise of high lift devices, it is inconvenient for plan designing and optimization. Thus, how to apply appropriate aero-acoustic analysis technology is really crucial.
A CFD method based on implicit large eddy simulation is used in this paper to solve the flow field with the thickness taken into account for multi-element airfoils to acquire the pressure fluctuation. Then FW-H sound analogy is applied to compute the near and far field noise. For the aerodynamics, the computation program based on the steady Euler equations is utilized so that the software applied can be efficient and fast in practice.
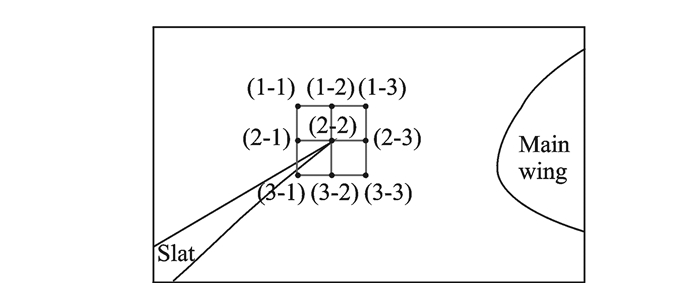
3.1 Optimization strategyThe analysis of slat noise mechanism shows that, the slat noise mainly comes from the cavity recirculation underneath the trailing edge and the lower surface of slat. The sound wave propagates through the slot region. Therefore, a type of passive noise reduction technology is studied, which lies in the adjustment of the position parameters of slat and main wing. In terms of aerodynamics design, the slat will delay the flow separation and stall so as to have sufficient maximum lift coefficient. Whereas, the key parameter that influences the flow separation characteristics is the relative angle between the slat and the main wing. In order to ensure that the characteristics are wnchanged, the optimization plan is adopted, in where the relative position between the slat and the main wing is changed while the relative angle keeps the same. As shown in Fig. 8, the baseline is 2-2, and the other eight points are deployed evenly on the four edges of a square of which the center is 2-2. These points are located respectively on the endpoints and the center, with the distance away from the baseline being 0.5%C. Next, the same numerical method and mesh with the same topology are applied to compute these nine cases. Afterwards, the results are obtained.
|
Fig. 8 Research points in nine different positions |
3.2 Results of aero-acoustic optimization
The distributions of Mach number, root mean square of pressure and turbulence kinetic energy at the nine points are analyzed. Moreover, the source of noise and the variation trend of the noise amplitude are also analyzed. Then one analyzes the directivity of near flow field noise to find out the optimum solution. Since the relative positions of these nine cases do not vary too much, the correspondent grids merely differ a little from each other. The computing in 1-1 does not converge well, despite some adjustments are attempted. As a consequence, this type of configuration will not be analyzed below.
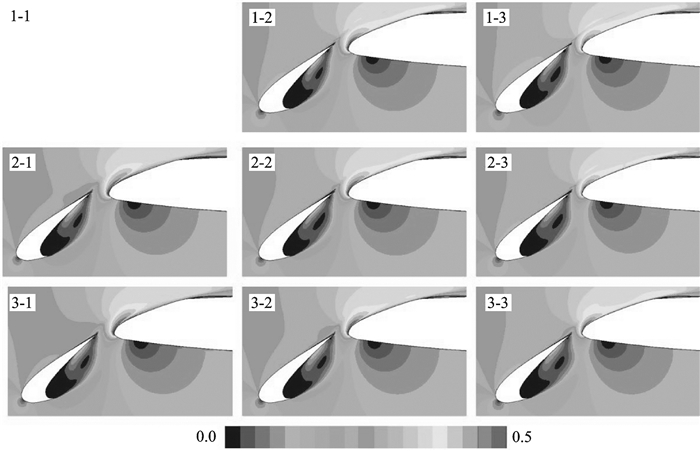
The base type (2-2) is shown in Fig. 9. The free shear layer comes from slat CUSP, then it is accelerated when passing through the slot region. The maximum Mach number takes place in the slot region, and precisely near the leading edge of the main wing. Since the demand for reverting of pressure is slacken, the separation at the leading edge can be put off. The low speed recirculation is located in the cavity.
|
Fig. 9 Time averaged Mach number distribution |
By comparing these cases, the high speed range at the leading edge of the main wing reduces gradually from the left cases to the right ones, while it remains almost the same from the top cases to the bottom ones. That can be explained by the distance between the slat and the main wing. In other words, with the distance diminishing, energy can hardly assemble or develop, such that the velocity of flow decelerates, and it leads to the attenuation of noise.
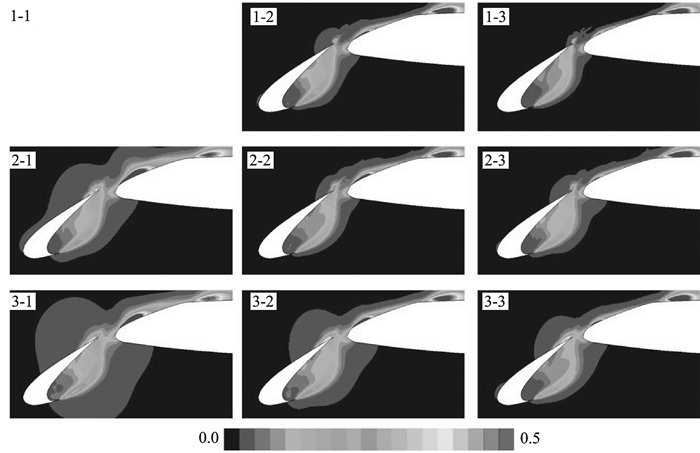
As the base type (2-2) shown in Fig. 10, the root mean square reduces with the free shear layer propagating from the slat CUSP to the slat tailing edge. When the free shear layer collides with the slat tailing edge, the pressure wave propagates into the slat cavity. As a result, the root mean square in the cavity increases. And the peak value takes place in the separation region of laminar flow in the main wing leading edge, while another peak value occurs around the separation region in the slat tailing edge.
|
Fig. 10 Root mean square of pressure |
By comparing from the left cases to the right ones, the pressure fluctuation in the slat tailing edge and in the main wing leading edge is diminishing. The pressure fluctuation is reducing as well from the bottom cases to the top ones. It is clear that the pressure fluctuation is the principal source of near field noise, and that the noise can be depressed by reducing the pressure fluctuation. Hence, a preliminary conclusion is obtained that the reduction of the relative distance between the slat and the main wing leads to the pressure fluctuation in the slat tailing edge and the main wing leading edge, so does the movement upward of slat.
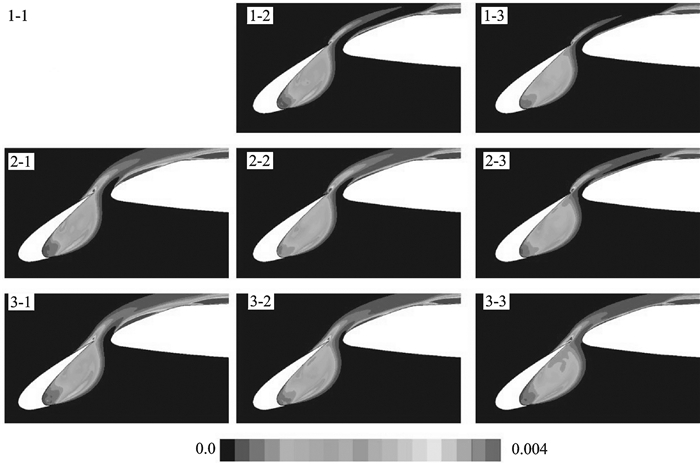
Fig. 11 shows the turbulence kinetic energy distribution. For these eight cases, the turbulence kinetic energy in the slat leading edge is in a quite low level due to the separation of the laminar flow at the slat CUSP. The vortex carried by the free shear layer causes the apparition large turbulence kinetic energy. That is because the vortex structure around the adhered points in the shear layer produces violent torture and stretch, which canses a high turbulence kinetic energy peak value near the slat tailing edge.
|
Fig. 11 Turbulence kinetic energy |
By comparing the cases shown by row from the left to the right, it is obviously that the turbulence kinetic energy decreases in the internal of slap cavity and in the main wing leading edge. By comparing those shown by column from the top to the bottom, the augmentation of the turbulence kinetic energy is observed. The dispersed vortexes taken by the shear layer collide with the wall surface. Thus, the noise comes into being. So, the noise can be reduced by abating the turbulence kinetic energy before collision. Moreover, certain vortexes enter into the slat cavity, and will restrain the newborn shear layer after recirculation, and then a flow recirculation feedback mechanismis formed. Obviously, this type of mechanism can be suppressed by reducing turbulence kinetic energy in the slat cavity, and thereby depress the noise source.
Figs. 12, 13 are the directivity diagrams of near field. The observation points are evenly distributed. Some observation points located the region of the main wing, so the curves are not closed. It is observed that the minimum noise takes place at 210°, while the maximum takes place at 30°. This is related to the relative angle between the slat and the main wing. It is clear that the slat leading edge is located at 210°, while the slat tailing edge is located at 30°, namely the slot.

|
Fig. 12 Comparison of near field directivity in lateral sense |

|
Fig. 13 Comparison of near field directivity in longitudinal sense |
It is obviously that the near field noise is reducing, by comparing the cases from the left to the right. As shown in Fig. 13, the near field noise is increasing from the top to the bottom. Evidently, the noise is minimal at 1-3.
For the noise strength of recipient point, the spanwise length has prominent effects on it, especially on the amplitude. Therefore, we analyze the directivity and the relative strength rather than the absolute value.
3.3 Aerodynamic and aero-acoustic synthetical analysisThe researches of the noise characteristic at each position necessitate taking the lift coefficients at different positions of the slat and the main wing into account. In order to design the multi-element airfoils, the unsteady computing based on ILES is only applied in noise analysis. And the MSES based on the Euler equations is applied for the steady aerodynamics computing. For the low speed airfoil design, the lift should be prominently considered, because the lift force corresponds directly to the separation characteristics, moment characteristics as well as the velocity characteristics, etc.
Table 1 shows that the relative distance between slat and main wing has little effects on the lift coefficient and drag coefficient (compared with baseline 2-2). The lift coefficient is about 1.8 and drag coefficient is about 0.27 when the angle of attack is 12°. With the slat moving up and down or left and right, the slot and the peak value of pressure near the main wing leading edge change due to the acceleration of flow through the slot. Also, the movements will influence the separation in the main wing tailing edge on the upper surface. Generally, the movement leftward or rightward has more influence than that upward or downward.
| Table 1 Lift coefficient, drag coefficient and CAA noise |
As shown in Figs. 12, 13, the sound pressure level is high at 270°, and it is more close to the observation point. Hence, the OASPL of this direction is chosen to be the criterion of optimization design, with more details shown in Table 1. The noise values are relative.
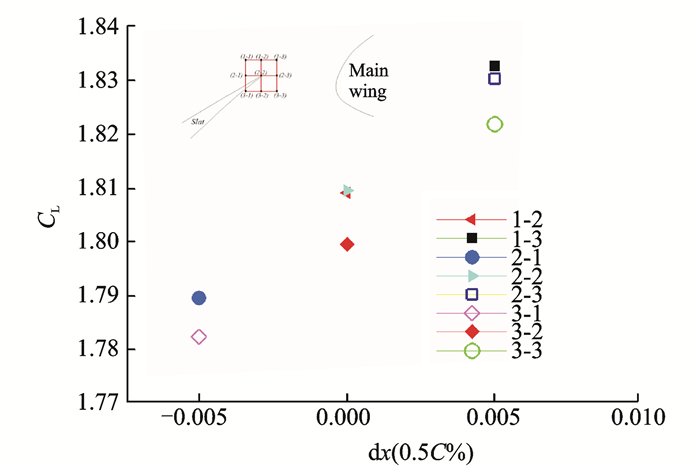
By analyzing above, the noise of the 1-3 point compared to that of 2-2 is observed as the minimum among these eight points, and we find that the noise variations of optimization have the same trend. By comparing the data of the aerodynamic force at different positions, as shown in Fig. 14, the lift coefficient increases with the slat approaching the main wing (dx=0.005), and it also increases with the slat moving upward. The increment of lift when moving from dz=0 to dz=0.005 is quite small, while it is larger when moving from dz=-0.005 to dz=0. It is observed that the point 1-3 is the optimal by taking both aerodynamics and aeroacoustics performances into account. The difference between the 1-3 and the basic configuration (2-2) is about -2 dB, and the lift increases slightly instead. Comparing with the worst case, we can see that the decrement is about 6 dB while the lift is much larger. So the slot parameters do have significant impacts on aeroacoustics performances.
|
Fig. 14 Lift coefficient of slat in 8 different positions |
4 Conclusions
Based on the research mentioned above, these conclusions can be obtained:
(1) One can utilize the following method to tackle the optimization design of multi-element aerodynamics and aero-acoustics: Analyzing in detail the multi-element configuration aero-acoustics, using ILES analysis for unsteady N-S equations based on high-order scheme, to evaluate the unsteady flow performances, and analyzing the mechanism of noise source to find a way to noise reduction; Designing the optimization window, and letting the multi-element airfoils vary step by step, then analyzing each case by the unsteady N-S equations, ILES method, and FW-H integral computing to get noise properties; Calculating the aerodynamics of each case by MSES to achieve the lift-drag performance.
(2) After the above analysis, the conclusion of multi-element airfoil's aerodynamic and aero-acoustic optimization is that, when the horizontal distance between slat and main wing is appropriately reduced, or when appropriately moving upward, the high speed range of the main wing leading edge can be narrowed, the pressure fluctuation as well as the turbulence kinetic energy can be depressed. As a result, the noise source is suppressed. Taking all the analysis of both aerodynamic and aero-acoustics performances in the eight positions into account, we come to a conclusion that the slat 1-3 is the optimal configuration.
| [1] |
DOBRZYNSKI W. Almost 40 years of airframe noise research-what did we achieve?[J]. Journal of Aircraft, 2010, 47(2): 353-367. DOI:10.2514/1.44457 |
| [2] |
BIELER H, FISCHER M, EMUNDS R, et al.CAA in industrial environment: First analysis of noise sources on a 2D high-lift profile at airbus: AIAA-2005-2977[R]. USA: AIAA, 2005.
|
| [3] |
DRELA M. Newton solution of coupled viscous/inviscous multi-element airfoil flows: AIAA-90-1470[J]. USA: AIAA, 1990.
|
| [4] |
DRELA M. Two dimensional transonic aerodynamic design and analysis using the Euler equations[D]. Cambridge: Massachusetts Institute of Technology, 1995.
|
| [5] |
BOERSMA B J. A 6th order staggered compact finite difference method for the incompressible Navier-Stokes and scalar transport equations[J]. Journal of Computational Physics, 2011, 230(12): 4940-4954. DOI:10.1016/j.jcp.2011.03.014 |
| [6] |
SHAROV D, NAKAHASHI K. Reordering of 3-D hybrid unstructured grids for vectorized LU-SGS Navier-Stokes computations: AIAA-97-2102[R]. USA: AIAA, 1997.
|
| [7] |
GRINSTEIN F F, MARGOLIN L G, RIDER W J. Implicit large eddy simulation:computing turbulent fluid dynamics[M]. UK: Cambridge University Press, 2007.
|
| [8] |
CHRISTIAN P, STEFFEN J. Efficient implicit LES method for the simulation of turbulent cavitating flows[J]. Journal of Computational Physics, 2016, 316(1): 453-469. |
| [9] |
FFOWCS WILLIAMS J E, HAWKINGS D L. Sound generation by turbulence and surfaces in arbitrary motion[J]. Proceedings of Royal Society A, 1969, 264(1): 321-342. |
| [10] |
KOLB A, FAULHABER P, DROBIETZ R, et al. Aeroacoustic wind tunnel measurements on a 2D high-lift configuration: AIAA Paper 2007-3447[R]. USA: AIAA 2007.
|
 2018, Vol. 35


